Tutorial: Using the Data Studio
For a full explanation of how the Data Studio connects to the canvas, see Data Studio.
This tutorial shows you how to get your data documents loaded and ready for a simulation. Takes about 5 minutes.
The Co-Engineer can do this for you. Ask it: "Activate the three most recent electrode coating documents in the Data Studio." It will select and activate the right documents without you needing to navigate here manually. Come to the Data Studio directly when you want to compare values visually or edit inline.
Step 1 — Open the Data Studio
Click Data Studio in the sidebar. When you first open it, it asks you to pick a schema.
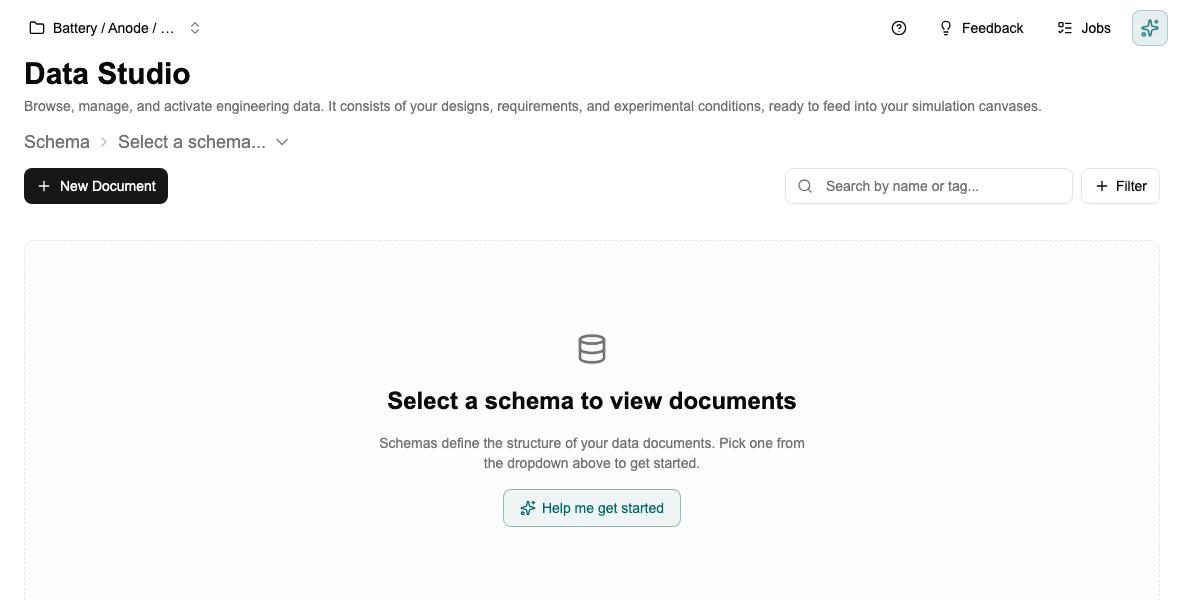
Step 2 — Pick a schema
Click the Select a schema… dropdown. All schemas in your project appear.
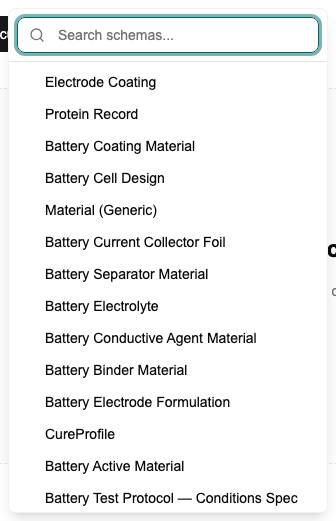
Click the schema you want to work with — for example Electrode Coating.
Step 3 — Activate documents
Click Select documents… in the toolbar above the table and choose the documents you want to compare — each selected document becomes a column.
With 3 documents activated you can compare their values side by side at a glance:
Step 4 — Pin a requirement (optional)
If your project has a requirements document (your target spec), you can pin it as a column next to your designs. This makes the gap between your current designs and your target immediately visible.
To add a requirements document, click Select documents… and choose it from the Requirements section of the popover — it appears as its own column alongside your design documents.
Step 5 — Edit values directly in the table
Double-click a cell in a document you created to change its value without leaving the Data Studio. Press Enter or click away to save — the change updates the original document immediately. (Inline editing is available only on documents you created.)
Step 6 — Analysis Panel
Analysis Panel — below the table is a resizable Analysis Panel (toggle with the g key) that opens with a Gap Analysis tab plus chart tabs you add yourself. Each graph has a Graph type setting — bar chart or scatter plot. Click + New Graph to add more chart tabs, rename them by double-clicking, remove one by hovering it and clicking the ×, or pin your layout as the default for new projects. On a bar chart or scatter tab, the download button exports the chart as a PNG or a PDF.
Step 7 — Feeding the canvas
Activating a document here makes it selectable in a canvas's Data input block — it doesn't add it to a block that already exists. Open the block in Simulation Studio to pick it up, then click Start sequence to run with the new inputs.
Editing a value here does flow straight through: anything approved downstream of a block that reads this document re-runs automatically.
Next step
→ Tutorial: Building Your First Canvas — now that your data is set up, build the calculation that runs on it.